Posts

πŸŒŸπŸ“Š Bridging Data and Geography: Excel Meets GIS πŸ“ŠπŸŒŸ

Image
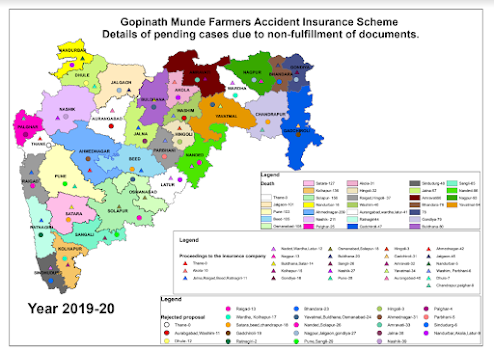
I'm excited to share a recent accomplishment where I turned raw Excel data from government departments into insightful legend maps using GIS tools! πŸ—Ί️πŸ” Here's how I approached this project: πŸ”Ή Data Integration : I meticulously aligned and joined Excel data with GIS shapefiles by matching similar fields across both datasets. This seamless integration ensured accurate data representation on the maps. πŸ”Ή Map Creation : Using GIS software, I developed dynamic legend maps that visually depict the integrated data, highlighting key trends and metrics across various regions. πŸ”Ή Enhanced Insights : The final maps offer a clear and actionable view of complex data, making it easier for stakeholders to understand and leverage the information for informed decision-making. By harmonizing data fields from Excel with shapefiles, this project showcases how effective data visualization can transform raw information into powerful, actionable insights. 

Interactive Leaflet Map of Village Land Parcels with Parcel Number and Owner Details.

Image
  Interactive Leaflet Map of Village Land Parcels with Parcel Number and Owner Details. Link For The Leaflet Map: https://kajol123-cell.github.io/Village_Land_Information/#14/20.9487/74.7269                      Project Overview Objective: The project involves creating an interactive web map of a village that displays land parcels with detailed information about each parcel. Users can click on individual parcels to view specific details such as the parcel number and owner information. Tools and Technologies Used: Leaflet:  A popular open-source JavaScript library for interactive maps. GIS Application:  Used for digitizing scanned maps and attributing parcel data. Process Overview: Data Collection and Preparation: Scanned Maps:  High-resolution scanned images of village maps were obtained. Digitization:  The scanned maps were digitized using a GIS (Geographic Information System) application. This involv

🚜🌍 Harnessing GIS for Risk Management in Agriculture: A Game Changer for Crop Insurance 🌍🚜

Image
 I'm excited to share some of the groundbreaking work we've been doing with GIS technology to revolutionize risk management in agriculture. By integrating geospatial data with field data, we've developed advanced tools that significantly enhance data visualization and decision-making for crop insurance. Here’s a glimpse into the benefits and results of our recent project: Link for ppt presentation:  https://docs.google.com/presentation/d/1koSaNoqYl-e8UttsnpHLIx2mXkDXjce5/edit?usp=sharing&ouid=103222577194977646189&rtpof=true&sd=true Key Benefits: Crop Presence Detection : Efficiently identify and verify crop presence with GIS-based mapping. Precise Insured Crop Area Calculation : Accurately determine insured crop areas, particularly for orchards. Real-Time Analysis : Empower decision-makers with real-time visualizations of farmlands and associated data at the click of a button. Enhanced Data Visualization : Digital maps reveal spatial patterns and correlations t

Creating a detailed base map in PDF format using ArcMap to share with a client

  Creating a detailed base map in PDF format using ArcMap to share with a client         Link For Map:- https://drive.google.com/file/d/1M53MU7BWIrC9Q8b9g1tFu2R50s1LJOmX/view?usp=drive_link Excited to Share Our Latest Project: Detailed Base Map Creation! πŸ—Ί️ We’ve just completed a comprehensive base map project for one of our valued clients, and I couldn’t be more thrilled with the sample data results! Using ArcMap, we meticulously digitized and styled a range of critical features to create an informative and visually appealing map. πŸ“ Key Features Included: Roads : Detailed Primary Roads and Highways Buildings : Residential and Commercial structures Land Use : Open Land Units, Agricultural Areas, and Green Belts Public Utilities : Water Tanks and Utility Zones Rail Infrastructure : Rail Tracks, Railway Platforms, and Platform Sheds Water Bodies : Rivers and other water features Zoning Areas : Residential, Recreational, and Commercial Zones Additional Infrastructure : Bridges, FOB Po

Creating a 3D Model Using GIS Data

Image
  Creating a 3D Model Using GIS Data Link For The Leaflet Map:    https://kajol123-cell.github.io/Test/ Project Overview In this project, advanced GIS technology and drone data have been leveraged to produce an accurate and detailed 3D model. The process involves several key stages: data collection, feature digitization, height extraction, and 3D model generation. Here's a detailed breakdown of each stage: 1. Data Collection Drone Outputs: Orthomosaic: A high-resolution, georeferenced composite image created from multiple overlapping drone images. It provides a detailed view of the study area with consistent color and geometric accuracy. DSM (Digital Surface Model): A raster model representing the Earth's surface and all features on it, including buildings, vegetation, and other objects. It provides elevation data of the topmost surface. DTM (Digital Terrain Model): A raster model representing the bare earth surface, excluding bu

🌟 Transforming History into Digital Precision: Digitizing Old Cadastral Maps! πŸ—Ί️✨

Image
I am thrilled to share our latest endeavor to bring historical cadastral maps into the digital age!I have successfully digitized a series of old cadastral maps using advanced GIS software, transforming them into precise, interactive digital formats. πŸ“ŠπŸ–₯️  Note(This is the sample data) link for map: https://kajol123-cell.github.io/Digitizing-Old-Cadastral-Maps/ What We Did: Map Digitization : I carefully scanned and georeferenced historical cadastral maps to create accurate digital versions. This process involved aligning old map features with modern geographic coordinates. Feature Extraction : Key features such as property boundaries, land parcels, and landmarks were meticulously traced and digitized, ensuring historical accuracy and relevance. Why It Matters: Preservation : Digitizing old maps preserves historical data and makes it accessible for future generations. Enhanced Analysis : Digital maps allow for advanced spatial analysis and comparison with current geographic data. Acces

πŸš€ Railways Embrace Drone Technology for Enhanced Surveys πŸš€

Image
  Introduction: The drone industry is soaring, with projections reaching billions in the coming decade. As sectors worldwide tap into its potential, the railway industry is leading the charge in leveraging drones to overcome traditional inspection challenges. Manual track inspections are not only time-consuming but also pose significant safety risks. Enter drones: capable of delivering high-resolution 2D models of extensive railway sections, depots, and stations with unprecedented efficiency. Methodology: Drones, or UAVs (Unmanned Aerial Vehicles), offer a game-changing approach to railway inspections. These versatile aircraft, controllable remotely or autonomously, can gather critical data swiftly and safely. By minimizing human presence on active tracks, drones reduce accident risks and expedite the inspection process. Benefits of Using Drones in Railways: Save Time: Drones streamline data collection across multiple tracks, automating the process to create a portable, repeatable,

πŸ” FRL Mapping and Rehabilitated Villages πŸ”

  1. FRL Mapping of Narmada River Submergence: Overview:    detailed FRL (Full Reservoir Level) mapping for the Narmada River. This essential task is critical for understanding the extent of submergence and its implications for surrounding areas. Key Details: Objective: To create an accurate and high-resolution map detailing the full extent of the river’s submergence areas. Method: Utilized advanced drone technology to capture precise data, allowing for comprehensive mapping of the river's submergence zone. Outcome: The FRL mapping provides invaluable insights for managing and planning the impact of water levels on surrounding lands and infrastructure. 2. Rehabilitated Villages for Narmada Development Board: Overview:  supported the Narmada Development Board in mapping and assessing rehabilitated villages affected by the Narmada River development projects. Key Details: Objective: To document and evaluate the conditions of villages that have been rehabilitated due to river devel